Explained: The Low SPM Passing Grade Table
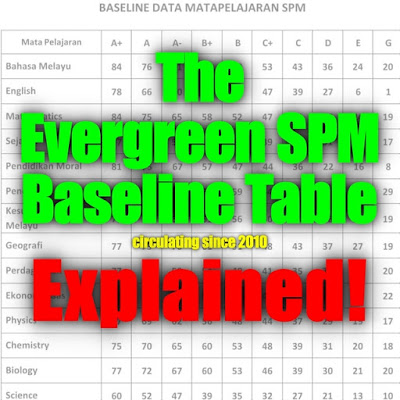
I bet you've seen this screen-captured table. I'm in a lot of education social media groups & every year around SPM season, this SPM baseline table will be reposted without fail in exactly the same way: some dude expressing shock at the low grades required for passing certain SPM subjects while lamenting the horrible state of our national education system. I enjoy intellectual discussions, but, if some random table is the basis for one's thesis, I roll my eyes & scroll away. However, I keep seeing this post repeating itself again & again & worse still I get tagged in some of them again & again until my eyes just can't roll any further. It's time to explain what a baseline is to those who are not teachers.
What Is Baseline Data?
Every school does this kind of data analysis, which is why those who cry wolf are usually not teachers. Why? A baseline is used to estimate the possible grades of our exam-taking cohort based on past SPM results. How? Baseline data is created by associating actual SPM results with SPM trial results. Thus, if you scored 40 in your trial & your actual SPM result is an A, 40% will be recorded as the baseline to get an A in that subject. Of course, the numbers will be averaged out between every student achieving the same grade.
Reservations When Interpreting Baseline Data
Andrew Lang, a Scottish anthropologist known for collecting folklore like Rumplestiltskin, once cautioned against "using statistics as a drunken man uses lamp-posts, for support rather than for illumination."
Thus, it is simplistic to correlate this random baseline data plucked from who knows where without a source nor date with the actual results required for getting certain grades in SPM. This could very much be actual baseline data from a school somewhere in Malaysia, but it cannot be generalized to all schools in the nation. Here's why...
1. Different Student Preparedness Level: From Trial Exam To SPM
Let's not discount the effort put in by students between the time of the trial exam & SPM. They have at least 1-2 months for a final push for better exam results. In my experience as a teacher, the last few months are the golden period when even notorious students become like angels. We should never underestimate the progress someone who got a single digit mark in their trials can make with a month of extra diligence & focus.
Many students come out wondering why they didn't start doing this earlier. I wonder too myself, despite repeating the same mantra year in & year out like a broken record, "start in Form 4, people. No such thing as a honeymoon year."
My personal experience speaks to this too. I failed my trial BM paper, but scored A1 in SPM. My failure during the trials lit a fire under me & taught me a major lesson that I made sure I didn't repeat during SPM. The baseline data for my school that year would have been messed up thanks to me. Imagine a failing grade associated with A1. Lol. Make that viral on social media.
2. Different Trial Exam Questions: From School To School
We can't generalize the baseline data from one school with those of other schools in the country because each school uses a different set of exam questions generated by their teachers. These papers would different in terms of level of difficulty & format of questioning.
Granted, some states or districts have a common paper generated by selected teachers in the state, which is great for ensuring that the trial papers adhere to the latest SPM format & level of difficulty. Unfortunately, this is not the case for all schools, so any baseline data generated should not be generalized.
3. Different Teachers Grade Differently
Even when all the trial exam papers in the entire country is standardized, different teachers will grade the exact same answers differently, especially for subjective questions, like essays or HOTS questions. This is the major reason why baseline data from one school can look extremely different from those of another school.
We can't expect regular schools to do what a national body spends millions doing every year. Thus, some disparity between grades given by different teachers is to be expected. Shrewd school leaders know this. If their teacher is known for being strict, the baseline data is usually lower than the actual SPM performance. On the other hand, if a teacher is known for being lenient, then the opposite would be true. If a teacher is unreliable, well, the same can be said of the baseline data being generated for that subject.
Conclusion
Please don't fall for random tables or statistics shared on the internet. Younger people are already aware of this & are actually more media literate than older generations. Just ask your kids if they should believe everything that comes out of WhatsApp or Facebook, you'll be surprised at their mature answers. It's old people like us that are susceptible to building arguments like graduates from the university of WhatsApp & Facebook, USA.
I hope that this explanation gives you a better understanding of how baseline data is being utilized at school. Feel free to ask any questions you might have in the comments. Wishing you all the best & much success to the SPM students of this year!


